Research
Now that we have a feeling for basic financial statements, we looked into the information behind the numbers.
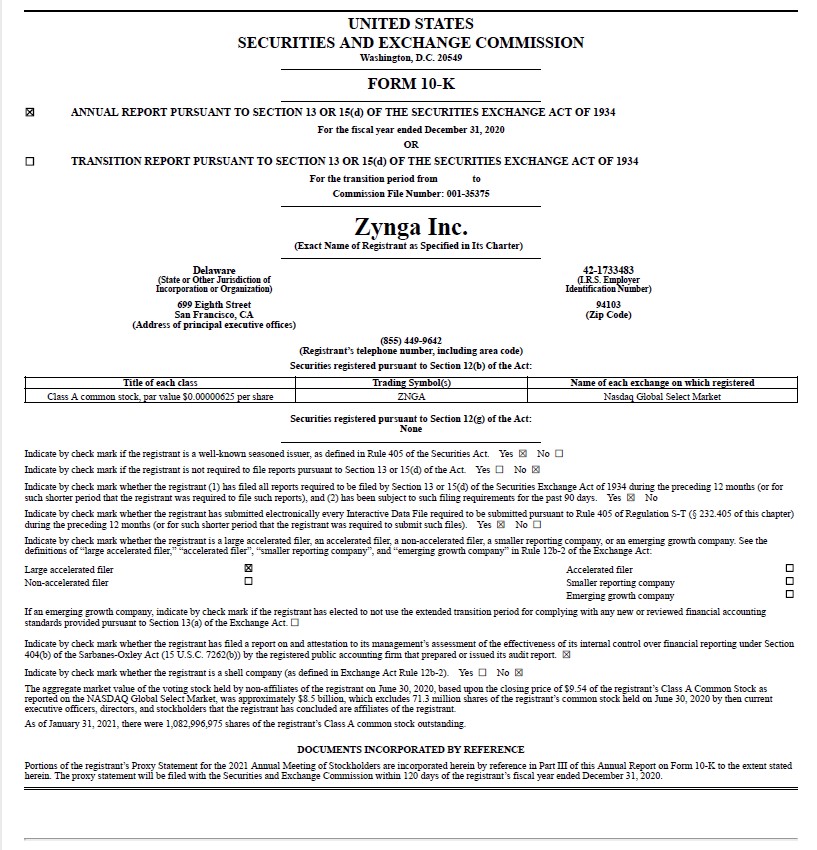
What can we learn from financial results about a company’s business model? We dove into some details in Zynga’s 2020 Q4 10k statement – the filing companies make with the SEC each quarter about their financial results.
Public financial statements include a trove of information other than just the numbers. We only looked at 11 of the 150 pages and learned:
- Mission and Strengths – page 2: 4 items
- Revenue explanations – page 3: 3.4% MUPs – metric! Important to have many free players for social draw. Top 3 games were 45% of rev. Ad rev primarily from Words with Friends.
- Marketing and Distribution – page 4: Advertise primarily in-app and FB and Google. 49% rev through Apple 46% through Google.
- Competition – page 5: Direct and Indirect!
- Employees – page 6: Culture and values.
- Risk Factors – page 8-30
- Consumable vs. Durable virtual items – page 66
- Acquisitions – page 36: Details under 2020 Highlights.
- How we generate Revenue – page 38: Online games, advertising.
- Key Metrics – page 38: Financial – revenue and bookings. DAUs, MAU, MUU, MUP, ABPU (ARPU).
- Other Metrics – page 40: ABPU/MUP – an actual ratio!
- Breakdown of financials after that.
Modeling and Metrics
How can we use that kind of information to figure out more about how our company works? Building a model (rather than a plan) can help us understand how money flows through our company. We can test different scenarios to see if we have a sustainable model, and find where risks and unknowns might be. We do this by creating a simulation in a spreadsheet.
For a simulation we need to know:
- Drivers – these are the knobs and levers we can adjust. These are usually “rates” of some sort (e.g. cost/unit, dollars/hour, price/subscription…) or percentages (e. g. interest rates, customer conversion rate, customer churn…).
- Rules – the formulae we will build our simulation with. These can be simple (total revenue = units sold * price/unit) or more complex (e.g. how our ad dollars turn into website visits which convert into product evaluations, which convert into paying customers – each step with a cost and attrition rate).
- Assumptions – starting values. Things like how many customers do we already have at the beginning of the simulation, and how much money is in the bank? They are also the initial values we put into our drivers.
And finally we need to define some metrics that we’ll use to evaluate the results. Metrics ideally should be a ratio – a number without units. Examples include growth rate, profit margin, and LCV/CAC (lifetime customer value / customer acquisition cost).
In our next class, we’ll start creating financial models for our companies.
More on Modeling
CMU Swartz Center for Entrepreneurship has a series of videos available on all sorts of startup issues. Here’s a recent talk by Phil Compton on his approach to financial modeling. It goes in greater depth that we do in class about what you would build both to help your company and to educate potential investors.